Finetune your wheat values using in vivo based tool

Using a Precise Nutrition Evaluation (PNE) platform can help get closer to achieving precise nutrition formulation to further optimise diets for livestock.
Wheat, as well as being a major feed ingredient for monogastric species, is also reported to be the most variable cereal in terms of nutritive value. It is a major energy component of most diets as well as supplying key amino acids. For efficiency, it is essential to be able to discriminate the nutritional quality of wheat – so samples from across Europe were surveyed to learn more about their variability. The PNE (Precise Nutrition Evaluation) platform is a highly valuable tool that nutritionists can routinely use, to update the nutritional matrix values of wheat, and to get a step closer to precise nutrition formulation. The data enables feed formulators to better predict the digestible energy and amino acid content of wheat to further optimise diets.
Top cereal
Wheat is an extremely important crop across Europe, in 2021/2022 soft wheat accounted for 44% of cereal production in the EU-27, with 129 million tonnes produced, according to EUROSTAT. This is far above the level of maize production, which was 73.2 million tonnes in the same period. Around 40% of the soft wheat produced is used in animal feed including poultry feed -mostly to supply energy but also protein and amino acids.
At the end of 2021 the price of wheat was 160% of what it was in 2015, according to EUROSTAT. The last two harvests have seen prices stabilise somewhat but with wheat making up much of the energetic cost of diets, its value is still high.
The variation in chemical composition of soft wheat is the result of genotype, environmental conditions, level of fertiliser used and maturity at harvest. This year climate conditions around harvest have been challenging in many regions, with heavy rain and drought affecting both yield and quality. This makes it even more important for feed formulators and poultry nutritionists to precisely assess the nutritive value of wheat received at the feed mill, to optimise their use in poultry feeding.
Precision nutrition
Adisseo has developed robust Near Infrared Spectroscopy (NIRS) calibrations built from in vivo measurements, over several years. In particular, Apparent Metabolisable Energy (corrected or not from nitrogen – AME and AMEn) – measured on 22-day old broilers. It offers nutritionists a fast, discriminating tool to monitor variability and provide digestibility data, to improve the nutrient matrix for wheat.
The survey
The nutritional quality and variability of 136 samples of wheat, from the 2021 EU harvest, were assessed using NIRS. The aim was to check for existing differences between countries of origin and to look for PNE variables in groups of samples. The study then measured variability for each predicted parameter and looked for those that best explained the variance. It was able to discriminate wheat samples according to their complete nutritional profile. This new research was presented at BOKU-Symposium Animal Nutrition, in Austria this April.
Variability
The average dry matter content (87%) for the 136 wheats varied by 1.2%, results were then expressed on dry matter basis to enable comparisons. The crude protein (CP) factor varied by 12.6% for all samples (Table 1), with an average value of 13.2g/100g DM. Wheat protein content depends considerably on agronomic and climate conditions. For most of the other proximate values there was huge variability between samples – around 6-7% CV. In comparison, a maximum 3% CV was observed for in vivo predicted AME, equivalent to 100 kcal /kg DM.
Energy prediction
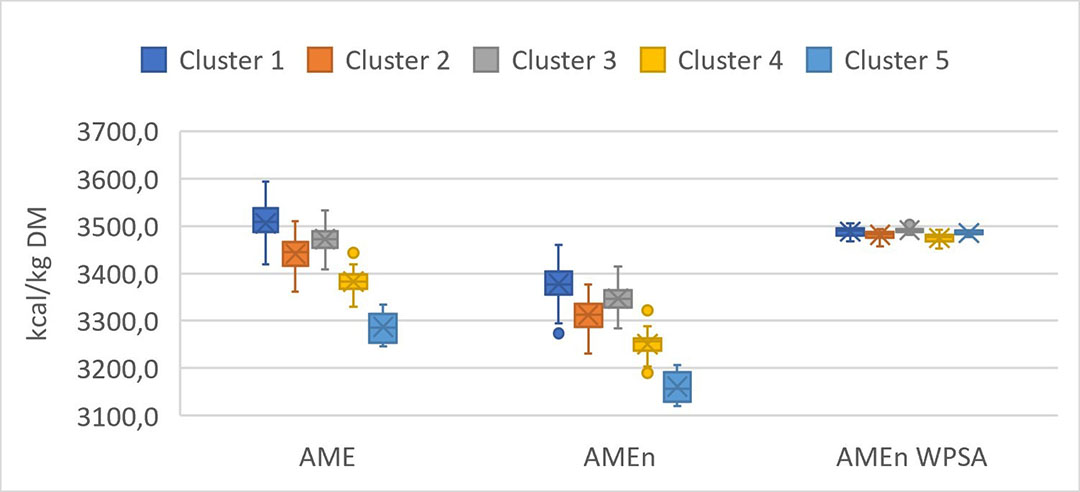
Performing hierarchical analysis, the wheat samples were placed into five distinct groups according to their full nutritive value. Figure 1 shows that for in vivo predicted AME, there was a difference of more than 200 kcal/kg DM between the highest, Group 1 and the lowest, Group 5. Groups 2, 3 and 4 contained intermediate values – all groups included wheat from various countries of origin.
Figure 1- Energy by cluster, predicted from in vivo (AME and AMEn) and calculated from proximates (AMEn, WPSA).

Energy calculation from proximate values (AMEn WPSA) did not allow any discrimination between groups of samples, but PNE enabled the discrimination. Predicting digestibility content of energy is essential to monitor wheat variability and to discriminate nutritional qualities.
Energy vs protein
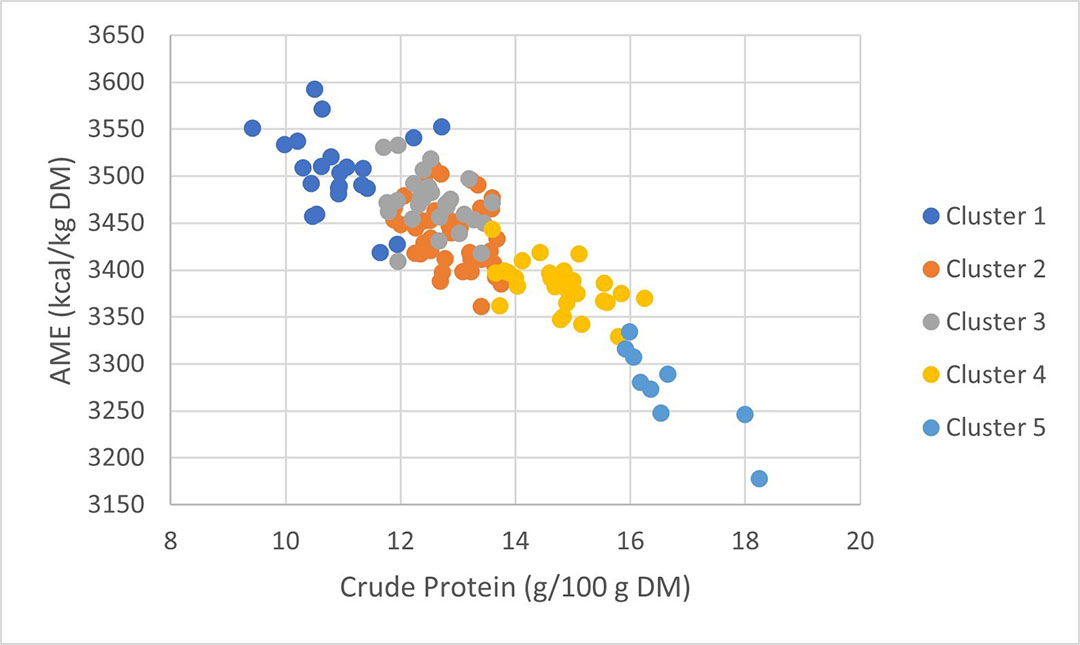
A strong negative relationship between AME (and AMEn) and crude protein was found in the wheat samples (r = -0.86) (Figure 2). And can be seen to corollate with the clusters of wheat previously identified.
Figure 2- Negative relationship between AME and crude protein in wheat samples.

It is only possible to observe this relationship using data based on in vivo calculations, it can’t be found using proximate analysis alone. This highlights the increased precision of PNE, and when formulating using the nutritional value of wheat the monetary difference is clear. Taking the example of the nutritional profile of wheat in cluster 3 (where the nutritional value was the most balanced), the other wheats should have cost 8 to18 EUROS/T less.
Robust quality control plan for wheat
It is not suitable to link nutritional profile and country of origin of samples. Checking dry matter, crude protein and energy predicted from in vivo results – is the best way to discriminate between samples of wheat. These parameters can be routinely checked at the feed mill and fed into PNE, increasing the robustness of quality control plans.


